

Data Science & AI
Dive deep into data-driven technologies: Machine Learning, Reinforcement Learning, Data Mining, Big Data, NLP & more. Stay updated.
Search inside The Magazine
Source:
- Il Sole 24 Ore, published on March 24th, 2025
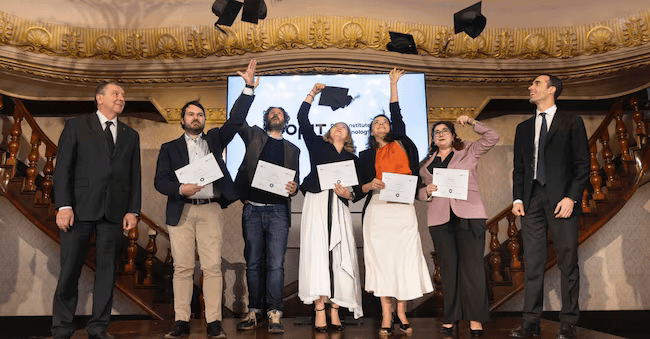
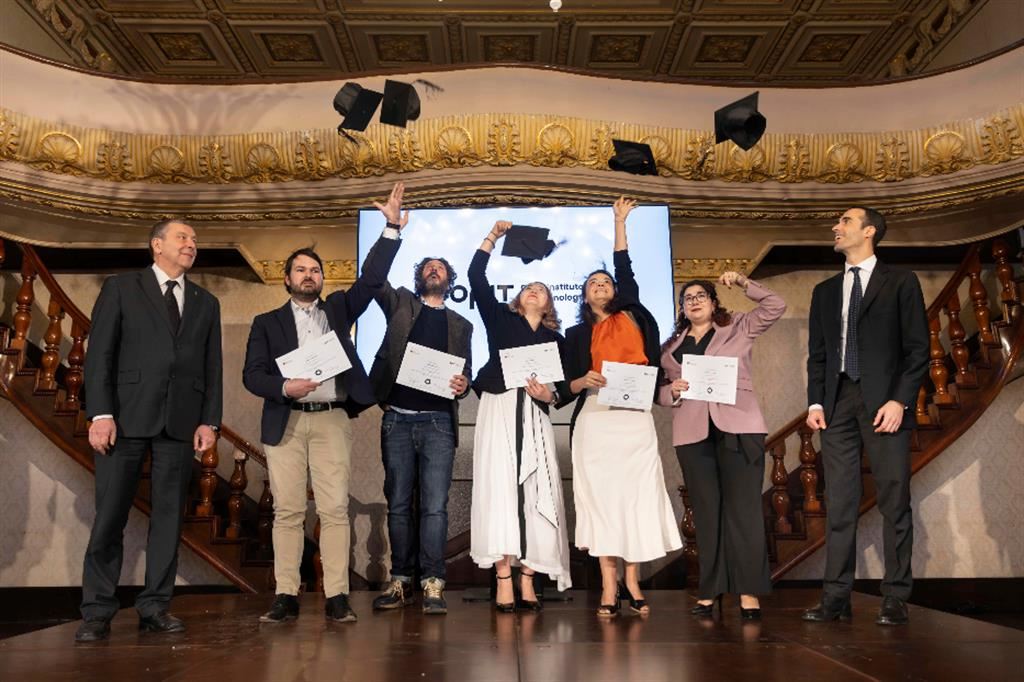
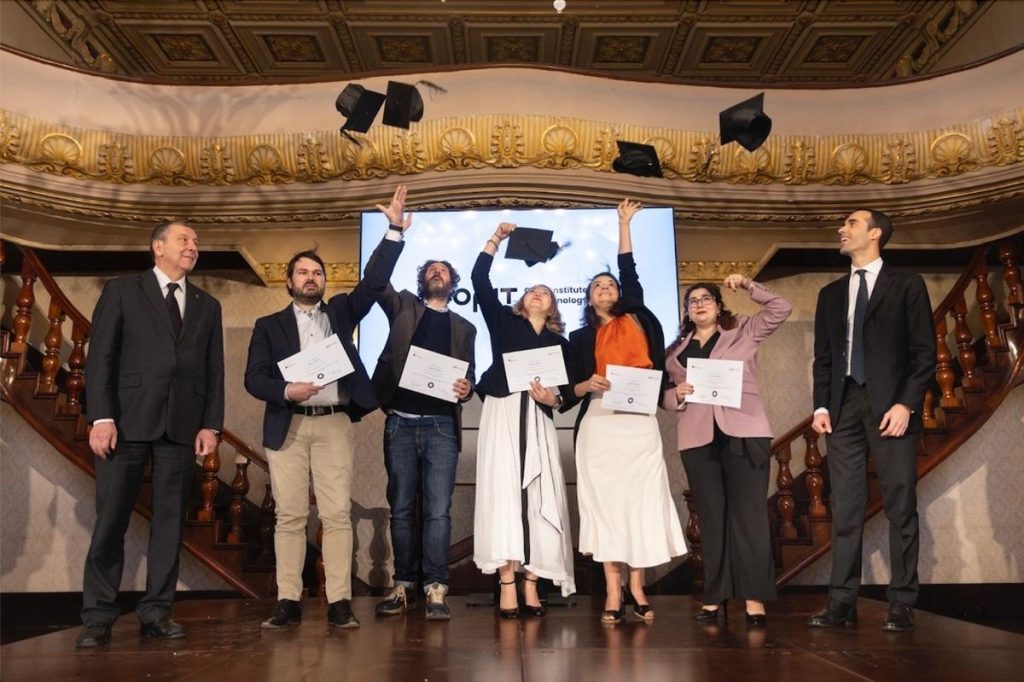
Just two years after its launch, the online and European-accredited academic institution, whose rector is former minister Francesco Profumo, confirms its growth with over 300 students from 78 countries and an international faculty of excellence.
OPIT (Open Institute of Technology), the European accredited academic institution (www.opit.com), has achieved its first milestone since it entered the higher education market in 2023: 40 students from 6 continents have completed the first master’s degree in Applied Data Science & AI, whose classes began in September two years ago.
The graduation ceremony took place at the central Casino Maltese in Valletta, Malta, where OPIT is regularly accredited, in the presence of Francesco Profumo and Riccardo Ocleppo, respectively Rector and founder, the Maltese Minister Clifton Grima (Education, Sport, Youth, Research and Innovation), and Rose Anne Cuschieri, CEO of the MFHEA authority. In addition to the graduates, the guests included some of the internationally renowned professors of the academic institution, such as Pierluigi Casale, Tomislav Vazdar, Art Sedighi and Francesco Derchi.
The projects
The students’ thesis projects have developed on innovative topics: the use of large language models for the creation of chatbots in the ed-tech field, the digitalization of customer support processes in the paper and non-woven industry, up to personal data protection systems and the use of Artificial Intelligence for environmental sustainability, predictive models for the prevention of disasters linked to climate change, the fight against money laundering, new perspectives of generative AI in the legal field (with a focus on Italian startups such as Giurimatrix). All of this has also been developed thanks to the launch of strategic collaborations with partner companies such as Neperia, Sintica, Cosmico, Dylog, Buffetti Finance and Hype, demonstrating the concrete approach and strong practical component that characterize the OPIT training experience.
“Today we celebrate the first chapter of a journey that will continue to grow with a consolidation of the current educational offering, new courses, doctoral programs, applied research and increasingly advanced training opportunities. We are only at the beginning, but this day demonstrates that OPIT is already a consolidated reality in the international academic panorama and a point of reference for those who want to be protagonists of the digital future” – declared the Rector Francesco Profumo.
The degrees
With two degrees already started in September 2023 – a three-year degree in Modern Computer Science and the aforementioned master’s degree in Applied Data Science & AI – and four more starting in September 2024 (a three-year degree in Digital Business, and the master’s degrees in Enterprise Cybersecurity, Applied Digital Business and Responsible Artificial Intelligence, which brings the total offer to 6 degrees), today OPIT is a point of reference for those who intend to take on the challenges of a job market increasingly oriented towards artificial intelligence and technology in the broad sense. Entirely in English and online, OPIT is enhanced by a high-profile international teaching staff, coming from leading universities and companies at a global level: 45 professors with international experience in both the academic and business worlds. Many of them have collaborated with Amazon, the European Parliament, NASA, Philips and numerous other leading companies, demonstrating the approach based on excellence that the institution has pursued since its foundation.
Evolving educational offering
As part of the development roadmap, OPIT is completing the evolution of its educational offering. Alongside the training programs already underway, 2025 will also be the year in which the research area will develop, paving the way, in the coming years, for doctoral programs and aligning itself even more with what universities around the world are already doing. In particular, OPIT has already started applied research projects with some companies on the topics on which its teaching is based: AI, computer science, cloud computing and cyber security. This year, a pre-degree Foundation Program will also be introduced, designed to provide solid academic foundations to aspiring students who do not meet the admission requirements for three-year degrees.

Source:
- La Stampa, published on March 11th, 2025
By Francesco Profumo
Education must therefore change its paradigm: from a system based on the accumulation of knowledge to a process that teaches how to think.
We live in an era in which access to information has become immediate and unlimited. All it takes is an internet search or a question to a virtual assistant to get answers on any topic. Yet, precisely in a world so saturated with data, a crucial challenge for education emerges: it is no longer enough to teach what to know, but it becomes essential to educate in critical thinking, in the ability to discern, connect and, above all, ask the right questions. After Trump’s election as President of the United States, this need to be able to discern between true and false has become even more important and starting to educate the new generations and re-educate the more mature ones along these lines can no longer be postponed over time.
Until a few decades ago, the value of education was linked to the acquisition of knowledge. Studying meant accumulating notions, mastering facts and concepts and then applying them. Today, however, the context has completely changed. Information is available everywhere, often in real time. The problem is no longer finding it, but understanding which is reliable, which has value and which is, instead, the result of distortions or manipulations. This transformation leads us to radically rethink the educational model: school can no longer be a simple place for transmitting knowledge, but must become an environment in which one learns to reason.
To achieve this, we can look at an ancient and ever-present approach: the Socratic method. Socrates did not give answers, but guided his interlocutors in the search for truth through continuous dialogue. With pressing questions, he pushed them to reflect on their beliefs, to question apparent certainties and to build a more solid and profound understanding of reality. This method, based on maieutics, did not simply transmit notions, but developed a mental attitude: the ability to question, to doubt, to explore with a critical spirit. Today, more than ever, we need to recover this attitude. In a world where technology presents us with a continuous flow of information and artificial intelligence promises to answer all our doubts, what really matters is how we formulate our questions. Knowing how to question reality becomes more important than the simple act of receiving an answer. The advent of artificial intelligence is accelerating the need for an education based on reflection and not on the mere acquisition of data. AI systems can generate texts, solve problems, propose analyses. But those who learn to use them without developing critical thinking risk becoming passive users, unable to distinguish between what is true and what is manipulated, between what is useful and what is irrelevant.
For this reason, the school of the future should transform itself into a laboratory of thought, where students are no longer evaluated only on the basis of the answers they provide, but on the quality of the questions they are able to ask. An education based on the Socratic method could be expressed through lessons focused on comparison, on the critical analysis of sources, on discussions that push students to defend or question different positions. Let’s imagine a classroom in which students do not limit themselves to studying notions, but are guided to explore a topic through open and challenging questions. Instead of explaining a phenomenon, the teacher could start a discussion, encouraging students to think about its causes, its implications, and its connections with other disciplines. Artificial intelligence could also become an active learning tool: not as a simple provider of answers, but as an interlocutor to interact with, to whom to submit increasingly sophisticated questions, experimenting with how the quality of interaction depends on the ability to formulate complex and well-structured questions.
Education must therefore change its paradigm: from a system based on the accumulation of knowledge to a process that teaches how to think. We must train students who are capable of navigating knowledge, not just storing it. In a future where work itself will be increasingly based on the ability to innovate, connect ideas and solve complex problems, these skills will be essential. The great educational challenge of the coming years will no longer be to teach notions, but to cultivate the ability to question the world. The question we must ask ourselves today is not only what we must teach our children, but how we can educate them to think critically and creatively. If we want the new generations to be truly ready to face the era of artificial intelligence, we must offer them something that no machine will ever be able to replace: the ability to ask questions that matter.
Source:
- Avvenire, published on March 20th, 2025
Diploma to the first 40 students of OPIT, Open Institute of Technology. Rector Profumo: “It is the first chapter of a path of continuous growth with new courses”
First graduates from OPIT (Open Institute of Technology), an exclusively online academic institution accredited at European level based in the Maltese capital Valletta. At the end of a study program that began in September 2023, 40 students from 6 continents have obtained a master’s degree in Applied Data Science & AI. The topics chosen for the theses are innovative: use of large language models for the creation of chatbots in the ed-tech field, digitalization of customer support processes in the paper and non-woven fabric industry, up to personal data protection systems and the use of Artificial Intelligence for environmental sustainability, predictive models for the prevention of disasters linked to climate change, fight against money laundering, new perspectives of generative AI in the legal field (with a focus on Italian startups such as Giurimatrix). The theses were also developed in collaboration with partner companies such as Neperia, Sintica, Cosmico, Dylog, Buffetti Finance and Hype.
“With these 40 graduates we celebrate the first chapter of a path that will continue to grow with a consolidation of the current educational offering, new courses, doctoral programs, applied research and increasingly advanced training opportunities”, underlines the rector of OPIT, Francesco Profumo.
OPIT currently offers six degree courses (a three-year degree in Modern Computer Science, a master’s degree in Applied Data Science & AI, a three-year degree in Digital Business and the master’s degrees in Enterprise Cybersecurity, Digital Business and Innovation and Responsible Artificial Intelligence), with a total catchment area of over 300 students from 78 countries and 6 continents, with an average age of 35. 80% of the enrolled population is represented by working students, destined to double based on projections on the number of students enrolled in degrees starting in 2025. This year, moreover, the research area will also develop, paving the way, in the coming years, for doctoral programs and aligning itself even more with what universities around the world already do.
“The success of this first class of graduates represents a significant milestone for OPIT and confirms our mission: to offer a high-level technological education, accessible globally and able to concretely respond to the needs of a constantly evolving job market”, recalls Riccardo Ocleppo, founder of OPIT.
Source:
- Times of Malta, published on March 18th, 2025
The Open Institute of Technology held its first-ever graduation ceremony in Valletta earlier this month, with students joining in person and virtually from across the globe.
The hybrid ceremony marked the successful completion of the Master of Science in Applied Data Science and Artificial Intelligence program by 20 OPIT graduates.
OPIT is a disruptive tech-focused higher education institution based in Malta.
With over 300 students from 78 countries, the institute offers EU-accredited undergraduate and postgraduate programmes in a variety of fields from game development, cyber security, and artificial intelligence.
The graduation ceremony was presided by Prof. Francesco Profumo, Rector of OPIT, and a former Education Minister of Italy.
He was joined by Ricardo Ocleppo, founder of OPIT, as well as Rose Anne Cuschieri, CEO of the Malta Further & Higher Education Authority (MFHEA).
“Our first ever graduation marks a new chapter not just for OPIT, but, and most importantly, for our graduates,” said Prof. Francesco Profumo.
OPIT’s approach to education integrates hands-on experience with cutting-edge technology, offering a practice-oriented curriculum that bridges the gap between theory and application.

Ricardo Ocleppo, founder of OPIT.
OPIT’s high-profile international teaching staff have been recruited from some of the best universities in the world, including Tier-1 institutes in the US, UK, Canada, Sweden, France, Germany, Italy, Brazil, Poland, Lebanon, and Spain.
On his part, Ricardo Ocleppo shared his reflections on how OPIT is dedicated to producing graduates who are not only job-ready but also prepared to lead the way in an ever-changing technological landscape.
Both Ocleppo and Profumo say they are on a mission to unlock students’ progress and employment on a global scale by providing high-quality and affordable education – a model based on the need for quality, flexibility, inclusivity, and the acquisition of crucial skills in future-ready sectors such as Artificial Intelligence.
OPIT’s student-centric approach delivers a combination of online learning and interactive discussions within a collaborative environment fostering advancement and innovation, including live lessons, masterclasses, videos, quizzes, exercises, and more internally developed digital content that students can access at any time.
With several students and faculty joining remotely, the ceremony also saw graduates present their capstone projects, many of which exhibit real-world applications of emerging technology.
More information about OPIT is available here.


Source:
- Sheerluxe, Published on January 29th, 2025.
AI is advancing at pace and is now set to transform society, the jobs market and how we do business. On the back of the prime minister pledging to turn the UK into an ‘AI superpower’, we checked in with the experts to find out the latest from the frontline…
What’s the most important thing business leaders or entrepreneurs need to be aware of?
“Leaders need to accept and understand what AI technology can do. I have lived through the internet boom and the initial AI comeback a decade ago in the form of machine learning. Both of these were waves of change in the IT industry that affected every aspect of our society and our lives. But I’ve never seen such a high speed of adoption as with generative AI. Even though the technology is young and not perfect, it is obvious that it fills a real need for most of us, individuals as well as businesses. Therefore, leaders must educate themselves in AI to learn the truth about its capabilities and risks. Use AI to solve a problem; do not invent a clever solution to a problem no one has. Be aware of the new risks that generative AI introduces, like hallucinations and toxicity, and allow use of AI accordingly for your own customers.” – Zorina Alliata, professor of responsible artificial intelligence, digital business & innovation at OPIT
Which industries do you predict will be most disrupted by AI in the next couple of years?
“The financial industry is always one of the first to adopt new technologies. Financial companies are already using generative AI for document processing, risk assessment, fraud prevention and algorithmic trading. Because of increased computing power, we also see AI growth in healthcare and life sciences for drug discovery and enhanced diagnostic procedures. Retail, education, logistics are also adopting AI at a high pace. Which industries will remain unaffected? None, really. Even in high-touch human professions like nursing, therapy, parenting, AI is a tool that can help. While not replacing the job entirely, the industry will change because the AI tools are changing the way the job is done.” – Zorina
Are there any new business models emerging due to AI advancements?
“I think we will see more AI-as-a-service (AIaaS) offerings, where AI tools are built on top of large language models and offer specific capabilities. This is an area where there is a lot of innovation, and I’m excited to see this develop further. I already use AIaaS on a daily basis for better writing, research, creating videos and presentations, and code debugging.” – Zorina
What are the biggest challenges for small businesses and start-ups in adopting AI technologies?
“A big risk is too much enthusiasm and optimism. Generative AI has been adopted at a great speed. When you first try it, it is amazing. It can write a whole paper in seconds. It can explain complex diagrams and concepts. It feels like the trusted assistant you always needed, but it’s important to remember that AI comes with risks. It’s one thing to write an AI service that recommends what movie you should watch next, and another thing to write an AI service that reads your X-ray and diagnoses if you have a tumour. These two applications of AI have very different risk thresholds. You need to plan your AI service or product to be appropriate for use and to minimise the risk for your customer. I’ve also seen start-ups that tried out an idea and are now planning to build a product out of it, without any understanding of what it takes to run AI services at scale. Having best practices implemented, a good operational foundation, governance and a clear operational model are all requisites for running any production systems, especially something as risky and fraught with unknowns as AI products are.” – Zorina
Which ethical considerations should entrepreneurs keep in mind when integrating AI into their businesses?
“Some considerations when creating your risk strategy for AI include data privacy and security (ensuring responsible collection and use of customer data); transparency (being clear about how AI is used in products or services); fairness and bias (addressing potential biases in AI algorithms); job displacement (considering the impact on employees and planning for transitions); accountability (establishing clear responsibility for AI-driven decisions); and environmental impact (considering the energy consumption of AI systems).” – Zorina
How is AI changing customer expectations?
“Customer expectations have gone up significantly since generative AI enabled better interactions. Customers expect omni-channel communications, immediate responses, and predictive service. For those companies that still have fragmented data in several platforms and lack a cohesive customer journey, the learning curve will be steeper. The good news is, there are a lot of innovations in this area.” – Zorina
What skills do you think entrepreneurs will need to succeed in an AI-dominated business world?
“Some skills that would be useful include:
- AI literacy: understanding the basics of AI, machine learning and data science.
- Data analysis & interpretation: ability to work with and derive insights from large datasets.
- Strategic thinking: identifying where AI can add value to business processes and products.
- Ethical decision-making: navigating the ethical implications of AI implementation.
- Adaptability & continuous learning: keeping up with rapidly evolving AI technologies.
- Human-AI collaboration: effectively working alongside AI systems.
- Soft skills: creativity, critical thinking, emotional intelligence and leadership will become even more valuable as AI handles more routine tasks.
As a leader, you are not required to write code or figure out the best way to deploy your model, but a high-level understanding of what AI can do will help you have meaningful conversations with your technical team and create AI products that are truly useful.” – Zorina
Finally, how will AI impact the workforce this year?
“There are several studies on this, such as the one the World Economic Forum (WEF) released this month about the status of work and the future of jobs. Some of the highlights are that AI and other technologies will continue to broaden digital access, with a first effect on increased demand for AI and data skills. The number of technology-related roles is the fastest growing, but frontline roles like farmworkers, delivery drivers and construction workers are predicted to see the largest growth. AI has evolved quickly to create images and videos, threatening the jobs of designers and movie producers. It was not what we would have predicted a few years ago. AI has a way of growing in unexpected ways, as we discover new paths of research and innovate ways to use it. I personally think it is hard to predict exactly where AI will go, and what will be the result of automating all routine tasks and behaving closer to humans. One thing we can be sure of is that people who understand AI and know how to use it will benefit from whatever new challenges are coming our way.” – Zorina
Read the full article below:

Source:
- The Yuan, Published on October 25th, 2024.
By Zorina Alliata
Artificial intelligence is a classic example of a mismatch between perceptions and reality, as people tend to overlook its positive aspects and fear it far more than what is warranted by its actual capabilities, argues AI strategist and professor Zorina Alliata.
ALEXANDRIA, VIRGINIA – In recent years, artificial intelligence (AI) has grown and developed into something much bigger than most people could have ever expected. Jokes about robots living among humans no longer seem so harmless, and the average person began to develop a new awareness of AI and all its uses. Unfortunately, however – as is often a human tendency – people became hyper-fixated on the negative aspects of AI, often forgetting about all the good it can do. One should therefore take a step back and remember that humanity is still only in the very early stages of developing real intelligence outside of the human brain, and so at this point AI is almost like a small child that humans are raising.
AI is still developing, growing, and adapting, and like any new tech it has its drawbacks. At one point, people had fears and doubts about electricity, calculators, and mobile phones – but now these have become ubiquitous aspects of everyday life, and it is not difficult to imagine a future in which this is the case for AI as well.
The development of AI certainly comes with relevant and real concerns that must be addressed – such as its controversial role in education, the potential job losses it might lead to, and its bias and inaccuracies. For every fear, however, there is also a ray of hope, and that is largely thanks to people and their ingenuity.
Looking at education, many educators around the world are worried about recent developments in AI. The frequently discussed ChatGPT – which is now on its fourth version – is a major red flag for many, causing concerns around plagiarism and creating fears that it will lead to the end of writing as people know it. This is one of the main factors that has increased the pessimistic reporting about AI that one so often sees in the media.
However, when one actually considers ChatGPT in its current state, it is safe to say that these fears are probably overblown. Can ChatGPT really replace the human mind, which is capable of so much that AI cannot replicate? As for educators, instead of assuming that all their students will want to cheat, they should instead consider the options for taking advantage of new tech to enhance the learning experience. Most people now know the tell-tale signs for identifying something that ChatGPT has written. Excessive use of numbered lists, repetitive language and poor comparison skills are just three ways to tell if a piece of writing is legitimate or if a bot is behind it. This author personally encourages the use of AI in the classes I teach. This is because it is better for students to understand what AI can do and how to use it as a tool in their learning instead of avoiding and fearing it, or being discouraged from using it no matter the circumstances.
Educators should therefore reframe the idea of ChatGPT in their minds, have open discussions with students about its uses, and help them understand that it is actually just another tool to help them learn more efficiently – and not a replacement for their own thoughts and words. Such frank discussions help students develop their critical thinking skills and start understanding their own influence on ChatGPT and other AI-powered tools.
By developing one’s understanding of AI’s actual capabilities, one can begin to understand its uses in everyday life. Some would have people believe that this means countless jobs will inevitably become obsolete, but that is not entirely true. Even if AI does replace some jobs, it will still need industry experts to guide it, meaning that entirely new jobs are being created at the same time as some older jobs are disappearing.
Adapting to AI is a new challenge for most industries, and it is certainly daunting at times. The reality, however, is that AI is not here to steal people’s jobs. If anything, it will change the nature of some jobs and may even improve them by making human workers more efficient and productive. If AI is to be a truly useful tool, it will still need humans. One should remember that humans working alongside AI and using it as a tool is key, because in most cases AI cannot do the job of a person by itself.
Is AI biased?
Why should one view AI as a tool and not a replacement? The main reason is because AI itself is still learning, and AI-powered tools such as ChatGPT do not understand bias. As a result, whenever ChatGPT is asked a question it will pull information from anywhere, and so it can easily repeat old biases. AI is learning from previous data, much of which is biased or out of date. Data about home ownership and mortgages, e.g., are often biased because non-white people in the United States could not get a mortgage until after the 1960s. The effect on data due to this lending discrimination is only now being fully understood.
AI is certainly biased at times, but that stems from human bias. Again, this just reinforces the need for humans to be in control of AI. AI is like a young child in that it is still absorbing what is happening around it. People must therefore not fear it, but instead guide it in the right direction.
For AI to be used as a tool, it must be treated as such. If one wanted to build a house, one would not expect one’s tools to be able to do the job alone – and AI must be viewed through a similar lens. By acknowledging this aspect of AI and taking control of humans’ role in its development, the world would be better placed to reap the benefits and quash the fears associated with AI. One should therefore not assume that all the doom and gloom one reads about AI is exactly as it seems. Instead, people should try experimenting with it and learning from it, and maybe soon they will realize that it was the best thing that could have happened to humanity.
Read the full article below:
Have questions?
Visit our FAQ page or get in touch with us!
Write us at +39 335 576 0263
Get in touch at hello@opit.com
Talk to one of our Study Advisors
We are international
We can speak in: